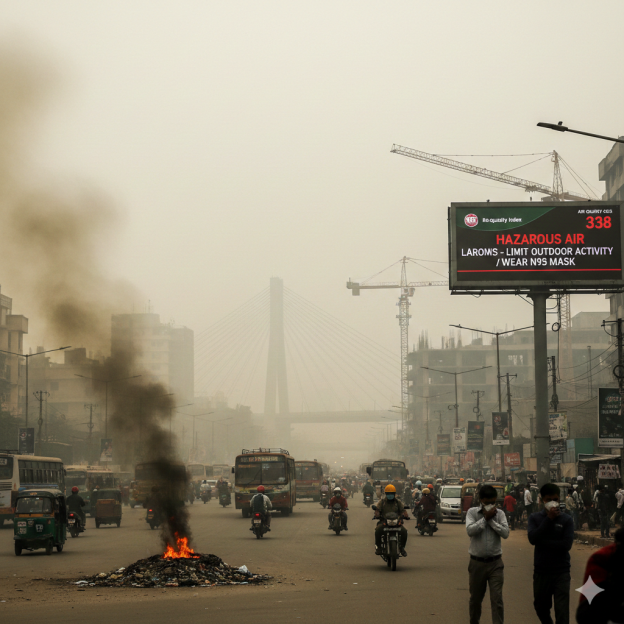
Author Archives: Murad

Battle over the Tourist Tax in London

One of the major bonuses for London in the last budget was the Tourist Tax for the major cities of the UK. The question which immediately arises is how that new Tourist Tax is apportioned between the Regional government and their local councils. Now the  impact of tourism on Central London councils is a complex “balancing act.” While tourism is the lifeblood of the local economy—generating £95bn in economic output (GVA) in Westminster alone—it creates significant “hidden costs” that councils often struggle to fund. So we need a breakdown of the impact across various sectors.

Most stay in hotels but increasingly in short term lets (STLs) as well. There is of course a massive disparity in how these two types of accommodation hotels and short-term lets (STLs) contribute to council coffers. Hotels are major contributors to local finances through Business Rates. They are regulated, provide predictable employment, and generally manage their own waste and security within their premises. While STLs on platforms like Airbnb have created a fiscal headache. Many STLs operate under the threshold for business rates and pay only standard Council Tax (or nothing if they are “hollowed out” secondary homes).  In London, it is illegal to let a whole property as an STL for more than 90 nights a year without planning permission. However, 2025 data shows that over 50% of STLs in Westminster consistently breach this limit. Councils like Westminster City Council spend significant resources on “digital detectives” to track down illegal lets, as platforms have historically been slow to share data, thus in enforcement costs. 

The most severe impact of tourism on councils is the depletion of the Private Rented Sector (PRS). Supply Depletion: In 2025/26, roughly 1 in 32 homes in London are used as short-term lets. In Central London boroughs like Westminster and Kensington & Chelsea, this ratio is much higher. So because so many long-term rentals have been converted into more profitable STLs, councils have fewer places to house homeless families. London councils currently face a £740 million annual shortfall in spending on temporary accommodation. This forces councils to move residents further away from their communities, increasing social care and transport costs.

Central London councils bear the brunt of maintaining the “stage” for the UK’s tourism industry without receiving a direct cut of the VAT generated. The operational pressures of the “tourism premium” can be outlined as below across services in Waste & Cleaning;  Noise & Anti Social Behaviour; 

Impact Category Local Council Responsibility The Tourism Strain
Waste & Cleaning Street sweeping and bins. Enormous footfall in the West End requires near-constant cleaning.
Noise & ASB Environmental Health teams. High volumes of complaints from residents living next to “party flats” (STLs).
Public Realm Paving, lighting, and signage. High wear-and-tear on infrastructure that residents ultimately pay to fix.
Policing Local safety teams. Managing night-time economy crowds and tourist-targeted crime (pickpocketing).

Therefore, one major indicator for the apportionment of the new Tourist Tax, would have to be the combined nights tourist ( serviced and short-term) sleep in the varies boroughs particularly in Central London where most tourist stay and use the facilities of London predominately serviced by the local councils. 

Obtaining the figures of occupancy of hotels and short-term lets, would suggest the following apportionment to local councils, judging by where the tourists stay in Greater London.

Borough Combined nights (serviced + short-term) % of London total
Westminster 44,780,140 26.93%
Camden 20,995,119 12.63%
Kensington & Chelsea 17,632,432 10.60%
Hillingdon 11,506,260 6.92%
Tower Hamlets 7,857,709 4.73%
City of London 6,686,811 4.02%
Southwark 6,423,939 3.86%
Newham 5,323,306 3.20%
Hammersmith & Fulham 5,070,381 3.05%
Lambeth 4,719,194 2.84%
Hounslow 4,332,421 2.61%
Islington 4,019,968 2.42%
Croydon 2,854,003 1.72%
Brent 2,680,775 1.61%
Ealing 2,522,684 1.52%
Greenwich 2,268,916 1.34%
Hackney 2,132,638 1.26%
Richmond upon Thames 1,905,422 1.15%
Barnet 1,640,281 0.99%
Wandsworth 1,548,031 0.93%
Redbridge 1,439,010 0.87%
Kingston upon Thames 1,341,819 0.81%
Enfield 868,597 0.52%
Harrow 795,481 0.48%
Waltham Forest 675,882 0.41%
Merton 639,691 0.38%
Havering 637,748 0.38%
Bexley 632,464 0.38%
Bromley 626,011 0.38%
Barking & Dagenham 624,069 0.38%
Lewisham 493,820 0.30%
Haringey 359,560 0.22%
Sutton 266,054 0.16%

Now let us see how the negotiations go between the Treasury, London Councils & the GLA go now for the 2026/27 contribution of this new tax on Tourists in London, to the services of local government in Central London. These percentages in the above table would be useful starting points for discussion. The percentages along for Central London boroughs make their case quite clear to all. 

Whats in the Referendum at Bangladesh General Election

The final document for a postal ballot paper in the 2026 Parliamentary Election in Bangladesh on the 12th of February where Voters are being asked one main question, as a result of course of the the student protests of July/August 2024 

Whether they agree with constitutional and electoral changes made by the government.

The changes include:

  • Ending the caretaker government system and holding elections under the current constitutional system.

  • Changing how Members of Parliament are elected, including adding 100 seats chosen proportionally.

  • Increasing women’s representation in Parliament and improving the role of opposition parties.

  • Strengthening democratic institutions, such as courts, parliamentary committees, local government, and protection of basic rights.

  • Implementing these changes with participation from all political parties represented in Parliament.

Voters must choose Yes if they support these changes or No if they do not, by marking one box.

So this should explains the postal ballots that have been sent out aboard to all NRBs registered on their App and the dilemmas facing them as voting day approaches. In the meantime, you will be seeing a lot of support for the referendum as illustrated in the flyer below which is saying  “Yes means Bangladesh. No means slavery.” 

Bangladesh GE Ballot for NRBs – Can someone explain?

Now that the Bangladesh General Election has been set for the 12th of Feb 2026, many are getting ready to vote, including Non-resident Bangladeshi (NRBs). 

For many years, NRBs have been campaigning to get the right to vote and also sort out the process for them to vote from aboard via the High Commission. This is not unlike many other nationals in London, like the Poles and Colombians in recent time who have voted from their respective embassies. So it was welcomed that the Electoral Commission of Bangladesh sorted out an App for this to happen unlike on previous occasions when many promises had been made by civilian governments but never delivered. 

As a result of registering via the App, many of those who have registered to vote for the 12th February have received their ballot for the General Election and referendum question response, as show above and below. Yet if we have a good look at the ballot, there are no names of candidates nor the parties standing against the various symbols.  Just a whole series of drawing of objects !  Now the parties of Bangladesh are often associated with objects like the Party at liberation in 1971, the Awami League which has been banned by the interim government from standing is associated with the boat “নৌকা” (Nouka).  The same with BNP which is associated with a sheaf of Paddy “ধানের শীষ” (Dhaner Shish) and the Jamaat Party with the scales of Justice “দাঁড়িপাল্লা” (Dãṛipallā) which are on the ballot form but it does not mention the party associations to the symbols and also buried amongst over 100 symbols. 

With the election so soon now, l am not sure the authorities could send out  a booklet explaining which parties are representing by the various objects on the ballot form at least.  In these circumstances l suspect many will no doubt just vote, “Not to vote” as the ballot permits them to do. Please see the last box at the bottom right hand corner. 

The final document is a postal ballot paper for the 2024 Parliamentary Election in Bangladesh where Voters are being asked one main question:

Whether they agree with constitutional and electoral changes made by the government.

The changes include:

  • Ending the caretaker government system and holding elections under the current constitutional system.

  • Changing how Members of Parliament are elected, including adding 100 seats chosen proportionally.

  • Increasing women’s representation in Parliament and improving the role of opposition parties.

  • Strengthening democratic institutions, such as courts, parliamentary committees, local government, and protection of basic rights.

  • Implementing these changes with participation from all political parties represented in Parliament.

Voters must choose Yes if they support these changes or No if they do not, by marking one box.

So l hope this all explains the postal ballots that have been sent out aboard to all NRBs registered on their App and the dilemmas facing them as voting day approaches. 


Even cyclists need the use of a car occasionally throughout the year

The Mayor of London’s transport policy aims to shift travel towards walking, cycling, and public transport (80% of trips by 2041) using the Healthy Streets Approach to create healthier, safer, and more sustainable journeys, reduce car dependency, improve air quality, and support new housing and jobs through better connectivity.

Key goals include Vision Zero (eliminating road deaths/serious injuries), achieving Net Zero for TfL operations by 2030, expanding the ULEZ, and major investments in the Tube and bus networks. So a core aim and goal is modal shift, using transport jargon. That is get 80% of London trips made by walking, cycling, or public transport by 2041.

Another is Healthy Streets, prioritise health and personal experience, making streets better for walking, cycling, and spending time in. Then we have of course Vision Zero: Eliminate all deaths and serious injuries on London’s roads by 2041, starting with buses by 2030. Linking it up with Mayoral climate commitments we have Net Zero: Make TfL’s operations Net Zero carbon by 2030. Which will also help Congestion & Pollution Reduction: Decrease traffic, improve air quality, and reduce noise. And finally Economic Growth of course, using transport investment to unlock new housing and job opportunities.

So key strategies & priorities were the Public Transport Focus – to enhance the experience on public transport to encourage shifts from cars. Active Travel –  invest in cycling infrastructure and making walking easier and safer. ULEZ Expansion – widen the Ultra Low Emission Zone to tackle pollution. Tube & Rail Upgrades – Modernise lines (Piccadilly, Central, District, etc.) and improve network coverage (4G/5G). Bus Network –  Transition to zero-emission buses and improve services, especially in outer London and finally  road safety – implement stricter standards for vehicles (Direct Vision Standard for HGVs) and better road design.

Yet in this strategising of Transport Policy in London, the place of car clubs has clearly been non-existent. This when over 250,000 London members of Zip Car, one of the major car clubs in London is now pulling out of the London market. This critical required working with London Councils on matters like parking charges for their cars has been long overlooked along with other local issues which need to be covered in a overall memorandum of understanding between operators, London Councils and TfL. 

And whilst the FT Lex Column can say the ZipCar business model run out of road because of their high fixed costs, it suspects rivals should buckle up. And the London Assembly Transport Committee Report, Stalling Car Clubs  issued before the Christmas break,  identifies a clear policy failure as TfL’s approach is seen as hindering growth, with concerns that their caution about increased car trips outweighs benefits like reduced private car ownership along with recommendations and calls for action. 

All l can say, it was a major oversight of the Mayors Transport Strategy particularly on shifting people into public transport, one should not forget that even keen cyclists need the use of a car! Those journeys where they may need a car or van over a year could amount to dozen times a year, but can quickly add up a few million trips in total in London over a year at the aggregate level. As a result, also trailing behind its rival cities on EV car clubs. Clean Cities’ 2023 report ranked London just 30th out of 42 European cities for deployment of electric car clubs, behind Paris, Rome, Brussels and Berlin.


Council Tax settlement impact in Westminster

Westminster Council’s financial situation involves balancing rising service demands (like homelessness support, social care) with reduced government grants, leading to budget gaps, but they also benefit from strong local revenue, allowing for relatively low council tax hikes (around 46p/week for Band D in 2024/25) and strategic investments through “Fairer Westminster” initiatives. Recent funding changes from the government, shifting funds to deprived areas, pose significant risks, potentially requiring higher council tax increases (even over 5% without a vote) and emergency funding, despite Westminster’s strong economic base from tourism and business rates.

All this whilst, the Institute of Fiscal Studies figures being quoted by the main stream media, of an 75 per cent increase in Council Tax as a result of government grant reductions to several London boroughs need to be explained by them more fully. As they don’t actually give us actual examples of the Council Tax going up amongst properties in the City of Westminster. 

The key aspects of Westminster’s finances involving the Council Tax, is they aim to keep Band D tax low, increasing it modestly (e.g., 46p/week in 2024/25) to fund vital services, benefiting from commercial revenue. Though there are budget pressures with significant costs arise from temporary accommodation for homelessness, adult social care, and inflation.

Furthermore,  the funding changes with recent government decisions shift funding from boroughs like Westminster and potentially forcing higher council tax rises or use of reserves. The Labour administrations “Fairer Westminster” Investments see the council invests in community support, CCTV, and care worker pay since 2022 and continued apace since. Their medium-term outlook, forecast budget gaps (e.g., £19.6m for 2026/27), but also plan for multi-billion pound capital programs and manage significant financial risks.  

With recent developments of late 2025, the Government Funding Review involves a new funding model shifting resources, impacting London boroughs like Westminster, who are expected to lose funds. The one concession given is that the Council Tax Cap Lifted do as the government allowing some councils, including Westminster, to raise council tax by over 5% without a referendum for two years, due to the dramatic  funding changes. The financial risks, faces now is in Westminster City Council faces a potential for large budget shortfalls (e.g., £68m by 2028/29) despite strong local income.

They must fight for a big slice of the Tourist Tax from the Mayor and lobby to get ring fenced funds like parking income to be used in the general fund and sell off any key assets in the West End like car parks for sure over the next few years to keep council taxes in the city low in comparison to the rest of London, as its residents are grown accustom too.  

All the figures for the council can be found on Westminster City Council Website, searching for “Cabinet reports,” “Medium Term Financial Plan,” and “Statement of Accounts” for detailed documents.


If Mexico City can do it, why not in London?

If we can have hanging gardens under elevated highways in Mexico City, l can not see why this can not also be done under the #Westway in West Central in places like  under the Marylebone Flyover ? If Mexico City, can do it, why not London? 

For some time, l have not been able to get figures of air pollution coming from the Westway into Paddington. This includes not getting figures not only when the Westway goes through the City of Westminster but also Royal Borough of Kensington & Chelsea whilst we have monitoring stations on the side of the Westway when going through the London Borough of Hammersmith & Fulham. This is by far the biggest highway into Central London with many HGVs from the West coming into Central London via this route. Some efforts have been made on this front, albeit not enough with the green wall along the side of the Edgware Rd Tube station (Bakerloo line).  

This image is more than an urban design project. It’s a reminder of how progress can be redefined. Mexico City didn’t tear the highway down. It didn’t wait for perfect conditions.
It transformed what already existed into something that gives back. That’s a powerful lesson for business and leadership. True innovation isn’t always about building something new.

Often, it’s about rethinking what’s already there and asking a better question:
Can this system create value beyond its original function?

In business, the same principle applies. Yet we have not heard anything from TfL in this respect of what its doing on the Westway apart from the urgent repairs.  Yet it suggests reducing air pollution is a core to its business now. Sustainable growth comes from integrating responsibility into the core not treating it as a side initiative.
In business, the same principle applies.


So when infrastructure cleans the air, when strategy serves both performance and people, efficiency and ethics stop being opposites.

That’s not idealism. That’s long-term thinking for you. 

Sylheti – dialect or language?

It is very funny that in all my trips to Sylhet, Bangladesh since 1971, l have never seen Sylheti Nagari script. There are plenty of signs in Bangla and English but never in the Sylheti Nagari script. And yet the first time, that l had seen it was in London at the front entrance of Channel S studios in Walthamstow. 

First of course, we have to acknowledge that Syloti is a separate language in itself and not a dialect of Bangla, as it often thought. It is an Eastern Indo-Aryan language spoken mainly in the Sylhet region of Bangladesh, and the neighbouring Barak Valley in the Indian state of Assam. 

It has 33 characters ( 5 vowels and 28 consonants) when compared to 51 of Bangla, and uses very few conjuncts characters. 

So it is clear Sylheti is linguistically independent with its own sound system including tones absent in Bangla and a grammar and morphology diverging from standard Bangla. Quite simply dialects don’t evolve their own scripts but languages do. 

It is thought that the Nagri language came with the companions of Shah Jalal who invaded Sylhet in 1303 AD and the language emerged a couple of centuries afterwards. The language is closely related to Bangla and most speakers are bilingual in Sylhoti and Bangla. 

Finally a trip to the studios of Channel S, is worth it just to see the Syloti script and the history of the region. All credit goes to them for putting all this history up on panels in their reception area. It beats going to a dusty further education library to see it all. 

Impact of EPC on property market in the UK

An Energy Performance Certificate (EPC) in the UK rates  a property’s energy efficiency from A (most efficient) to G (least efficient), showing potential fuel costs and carbon emissions, and is required when selling, renting, or building a home. It provides a visual rating, similar to a fridge’s sticker, plus recommendations for improvements, like better insulation or efficient lighting, with potential cost savings, and is valid for 10 years.

So the EPC shows Energy Efficiency Rating with a letter grade from A (best) to G (worst) based on the building’s fabric and services. And on the energy use front, the estimated energy consumption and costs.

The improvement recommendations have specific, cost-effective ways to boost efficiency, with potential ratings and savings listed. So you may need one when selling a property; when renting out a property (as a landlord) and when a new building is constructed. This whilst an EPC is valid for 10 years.

So its purpose it quite clear, to help prospective buyers or tenants understand running costs and environmental impact and its a legal requirement – Failing to get one when required can lead to fines.

The question then to be asked is whether EPC  has any impact house prices, indicating the housing market responds to the energy efficiency and climate change matters? 

There is growing evidence that the Energy Performance Certificate (EPC) rating of a property in the UK does tend to be reflected in its price. That said: how much it matters depends a lot on context (location, property type, buyer priorities, etc.). Here’s a breakdown of what research and market data show, and where the limits lie.

Why and when do EPC tend to affect property price needs to be asked. Here  a large-scale academic study — tracking over 333,000 dwellings sold more than once — found a positive relationship between energy efficiency (as measured by EPC rating) and sale price per square metre. The effect was especially noticeable for flats and terraced houses.

For Wales , a recent study of ~192,000 transactions showed that homes rated in bands A/B had a ~12.8% premium, and C-rated homes ~ 3.5% premium, compared with D-rated homes. Meanwhile, homes in poorer bands (E, F) carried statistically significant discounts (–3.6% and –6.5% respectively).

More recent analyses confirm the trend: a report by Oxford Economics (2024) finds that buyers are willing to pay on average ~ 3.4% more for a high efficiency home (A/B) compared with D-rating, and expect discounts for poor-performing houses.
Real-world market analyses show similar size effects: according to one survey, improving a property’s EPC from a low band to a higher one could add ~£13,000 in value on average, all else being equal.

In short: energy efficiency (and thus lower running costs) appears to factor into what people are willing to pay. This makes sense: lower bills and more modern, efficient homes tend to be more attractive — especially in the context of high energy prices or environmentally conscious buyers.

But it’s not the only or always the main factor, as the same research shows that other variables often dominate price — location, size, property type, local amenities, market conditions. EPC is often a secondary factor. The premium or discount attributable to EPC also tends to shrink when you move within the middle bands (e.g. C vs D) as opposed to the extremes (A/B vs E/F).

Some research and industry commentary emphasise uncertainty or variability: improvements needed to bump an EPC rating (insulation, heating upgrade, etc.) can be costly — so not every buyer will pay a premium high enough to reflect those costs.

For certain markets (older properties, rentals, or where EPC isn’t heavily considered), the “green premium” may be weaker or negligible.

So if you’re buying or selling: EPC is a real factor, especially in the current market where energy costs and environmental awareness influence buyer behaviour. Improving EPC rating (or buying a property with good EPC) can reasonably expect a price benefit, though exact numbers vary.

If you own a property rated low (e.g. E, F, G), you may see a discount relative to similar homes with better ratings. Conversely, investing in insulation, heating improvements, or other eco-upgrades may yield a respectable return — but only if potential buyers value those improvements.

If you’re a landlord or investor: the importance of EPC is rising, especially as regulation and tenant demand push for energy-efficient homes. Good EPC could make a property more attractive to renters, and may also support a higher resale value when you come to sell.

The wider context tells us the size of the premium depends heavily on region, type of dwelling, and what raters have assumed about the property’s structure. For instance, flats and terraces tend to show stronger EPC-price correlations than detached houses. So caveats need to be made. 

The research for Wales suggests that discounts for low-EPC homes are statistically significant, but not always massive — meaning other features (floor plan, location, condition) still matter a lot.

So not all homes with high EPC will sell at premium — and EPC isn’t always the deciding factor. Buyers may prioritise other factors (neighbourhood, size, layout, condition) especially if energy cost savings don’t offset the price difference.

All properties in the UK have EPC. To what extent do they affect the house prices, if at all?

All properties in the UK have EPC. To what extent do they affect the house prices, if at all?

The death of the Car Club in London

One of the immediate costs of Britain’s big experiment with taxing EVs  has been the loss of one of the big car club operators – ZipCar. It is currently in the process of ceasing all its UK operations by the end of December 2025 with bookings will be suspended beyond December 31, 2025.

The decision to withdraw from the UK market was influenced by several factors, including rising operational costs and the introduction of a new daily congestion charge for EVs in London starting in January 2026, and which would have increased prices for customers almost immediately and then we would have the tax of electric vehicles by mileage to help offset a fall in fuel duty from petrol cars, in April 2028, nationally.

This when London has the largest car club market in the UK with a significant fleet and membership of 250,000. Many of us who sold the car and took to cycling, joined these car clubs to have the safety of knowing there was a car always available around the corner for the odd car trip, with our car club membership. Alas this will no longer be the case certainly in London, as l work out how to do the trip to visit my mum on Christmas day without public transport and a car now, as it is too far away to be done by cycling. Clearly being multi-modal has its limits. 

Solar power booming in the UK

So far in 2025, the UK has experienced record-breaking solar panel installations and solar energy generation, driven by high energy prices and government incentives.

Some Key Statistics for 2025

Installations: Over 120,000 certified solar panel systems were installed in the first six months of 2025, a 36-37% increase compared to the same period in 2024. Nearly 100,000 of these were domestic systems.

Total Capacity: As of April 2025, the UK had a total operational solar capacity of 18.1 GW across approximately 1,780,000 installations.

New Capacity Added: The UK is expected to add between 3 GW and 3.5 GW of new solar capacity in 2025 alone. Over 2 GW of new capacity was completed in the first half of the year, a record start to the year for a decade.

Energy Generation: The first half of 2025 saw record solar generation of 9.91 TWh, a 32% rise. Solar energy accounted for 11.6% of UK electricity generation in May 2025, a record monthly share.

Market Share: Around 1.6 million homes in the UK now have solar panels, representing about 5.5% of households.


The surge in installations is attributed to:

Lower energy bills: Solar panels can significantly reduce household electricity costs.
Government Initiatives: Schemes like the Future Homes Standard (making solar mandatory on new homes from 2027) and the 0% VAT rate on installations have made renewable technology more accessible. The government also published a “Solar Roadmap” in June 2025 to accelerate deployment.

Falling Costs: The average cost per kW of a home solar installation has been trending downwards since mid-2023.

Energy Independence: Homeowners and businesses are increasingly seeking ways to achieve energy independence and protection from volatile energy prices.

Conclusion 

For a typical 4kW residential solar panel system in 2025, the average installed cost is around £6,500. Prices can vary based on system size and location, generally ranging from £3,000 to £25,000. For more information on solar panel installations and potential savings, visit the Energy Saving Trust. Official data and statistics on solar deployment are available from GOV.UK.