As of early 2026, Greater London operates three Mayoral Development Corporations (MDCs). These are special-purpose vehicles created by the Mayor of London under the Localism Act 2011 to fast-track the regeneration of strategically significant areas by taking over planning and development powers from local councils.
While they share a common legal framework, they differ vastly in their age, scale, and the “flavour” of regeneration they are pursuing.
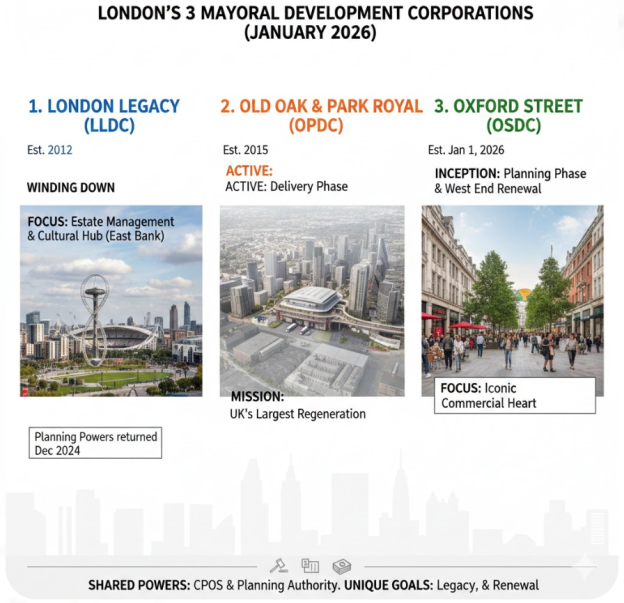
1. Origins and Strategic Purpose
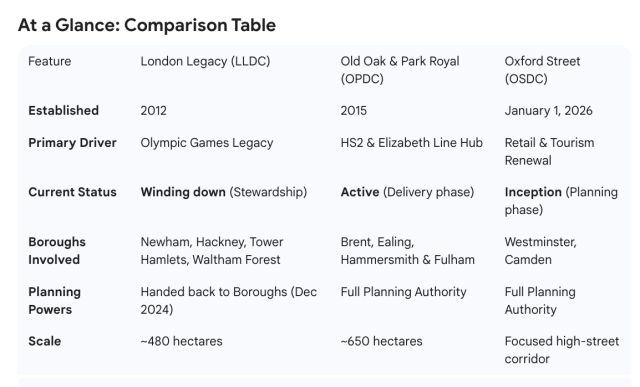
LLDC (The Veteran): Created to ensure the multi-billion pound investment in the 2012 Olympic Park wasn’t wasted. Its focus has shifted from “games delivery” to “place-making,” building a new cultural and educational heart (East Bank) for London.
OPDC (The Long-Hauler): Established to capitalise on the massive transport interchange at Old Oak Common (where HS2 meets the Elizabeth Line). It is one of the UK’s largest regeneration sites, aiming to create a “new Canary Wharf in the West.”
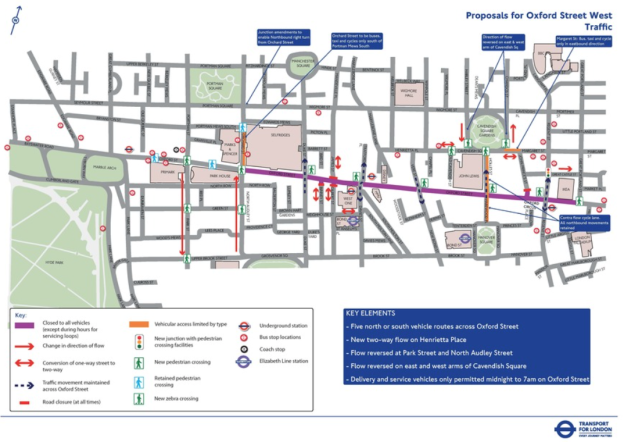
OSDC (The New Arrival): Unlike the others, OSDC was established in 2026 to solve a specific political and commercial impasse. Its goal is the “surgical” transformation of Oxford Street—specifically its pedestrianisation—to reverse the decline of the West End’s retail dominance.
2. Scale and Type of Regeneration
Area-Wide vs. Surgical: LLDC and OPDC are “traditional” regeneration cases covering vast swathes of formerly industrial or underused land (650 hectares for OPDC). OSDC is far more targeted, focusing on a specific corridor and its immediate surroundings.
Housing vs. Commercial: LLDC and OPDC have massive housing targets (thousands of homes). While OSDC will influence the upper floors of Oxford Street buildings, its primary focus is the public realm and “world-leading” retail/leisure experience rather than new residential neighbourhoods.
3. Governance and Local Friction
A core feature of an MDC is that it takes planning powers away from the local councils.
Collaboration vs. Conflict: LLDC has matured into a collaborative relationship with East London boroughs. Conversely, the OSDC was born out of significant friction; the Mayor established it specifically to bypass Westminster City Council’s historical opposition to full pedestrianisation.
Planning Authority: LLDC and OPDC are fully-fledged planning authorities. OSDC is scheduled too officially take over planning determination from Westminster and Camden on April 1, 2026.
4. Funding and Economic Models
The “Legacy” Model (LLDC): Funded through a mix of GLA grants, land sales, and a unique Fixed Estate Charge (FEC) paid by residents and businesses on the Park to maintain the high-quality public realm.
The “Transport-Led” Model (OPDC): Heavily reliant on national infrastructure timelines (HS2) and GLA funding to unlock complex, fragmented industrial land.
The “Commercial Hub” Model (OSDC): Expected to be funded by the GLA and potentially through partnerships with major West End landowners (like the Crown Estate and Great Portland Estates) who see pedestrianisation as essential for property values.
Summary of Differences
While LLDC is currently in a “handover” phase (gradually returning powers to boroughs as its work nears completion), OPDC is in the “heavy lifting” phase of building infrastructure. OSDC is in the “sprint” phase, with the Mayor aiming for rapid, high-visibility changes to the West End public realm before the next election cycle.